Extracting metrics from logs
Unduh
Mode fokus
Ukuran font
Background
When the CLS dashboard is used, users may occasionally encounter search timeouts that cause chart rendering failures. In such cases, consider converting log data into metric (Metric) data. Then use PromQL to query and analyze these metrics, as it delivers higher analytical performance than log data and can effectively resolve dashboard timeout issues.
Overview
Using scheduled SQL, you can extract metrics from logs and store them in metric topics. Compared to logs, metrics offer faster queries and smaller storage space, enabling seamless integration with the Prometheus ecosystem. For more details about metrics, refer to Metric Storage Overview.
The following content illustrates in the form of an example how to use scheduled SQL to convert to metrics. The business scenario is: extract 3 metrics (PV, failed requests, P99_request time) from Nginx logs. The Metric dimension is URL, and take the top 10 based on the size of PV.
Using scheduled SQL, we will complete the conversion of logs to metrics.
Operation Steps
1. Log in to the CLS console, select the Chongqing region, open the search and analysis page for the Nginx Demo log topic (free trial topic). For the Demo log topic, see use Demo logs to quickly experience CLS.
A single raw log is as follows:
{"remote_addr":"124.78.124.112""method":"GET""upstream_addr":"169.254.128.14:60002""upstream_response_length":"48""body_bytes_sent":"59""time_local":"2021-12-03T17:16:58+00:00""version":"HTTP/1.1""url":"/""http_user_agent":"-""remote_user":"-""req_id":"e3d1ae06b30344539bc7e28314d542fa""upstream_status":"400""request_time":"0.002""sys_address":"11.149.155.219""request_length":"40""http_referer":"-""sys_datasource":"gz.1.1.v1.2.19""proxy_upstream_name":"default-kubernetes-443""upstream_response_time":"0.000""time":"1702542388004""timestamp":"2023-12-14T16:26:28+08:00""status":"400"}
2. Open the search and analysis for the demo log topic and enter the following query statement:
select count(*)as pv, count_if(status>=400)as bad_request_count, approx_percentile(request_time,0.99) as P99_request_time,url group by url order by pv desc limit 10
The result is as shown below, confirming the accuracy of the query statement:
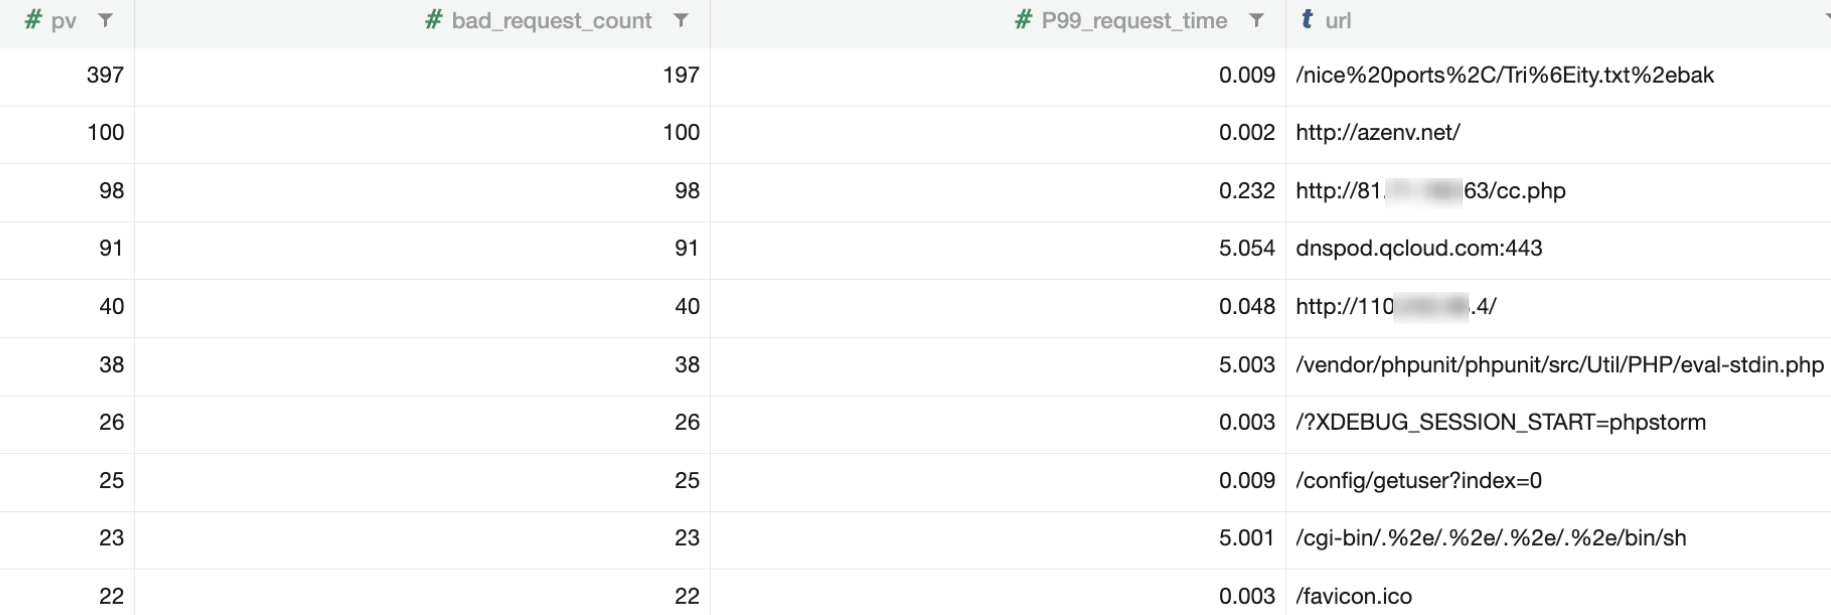
3. In the upper-right corner of the Statistical Charts TAB page, click Save as Scheduled SQL Analysis. Complete the Basic Configuration items.
Configuration Item | Description |
Task Name | Log2Metric |
Target Topic | Select the metric topic, which should be created in advance. The name in the example is NginxMetric. |
Query statement | * | select count(*)as pv, count_if(status>=400)as bad_request_count, approx_percentile(request_time,0.99) as P99_request_time,url group by url order by pv desc limit 10 |
Preview | Click Preview. |
Metric Name | The system automatically populates the statistical metrics (numeric type) in your SQL statement: pv, bad_request_count, P99_request_time. |
Metric Dimension | Click the drop-down menu, select url, which is usually the field after group by. In the example, it means grouping and counting by URL. |
Custom Dimension | {"Author","Coder"}. Add your own dimensions, which in actual production could be your development team, application, cluster, namespace, or similar. |
Timestamp | Default (left boundary of the query time window). For example, when data for 00:00:00-00:00:01 is queried, the generated metric's timestamp will be the left boundary of the window: 00:00:00. |
4. Click Next to go to the Scheduling Configuration.
Configuration Item | Description |
Duration | The data scope processed by Timer SQL. |
Scheduling cycle | 1 minute, meaning every 1 minute initiate a query and save the results to the metric topic. |
Query Time Window | Select the time expression @m-1m,@m, which means the query time range is the last 1 minute. |
5. Click OK to save the task.
6. In the upper-right corner of the search and analysis page, click More, then click Scheduled SQL Analysis, and select the task named log2Metric to go to the task details page.
7. In the current Scheduled SQL Analysis task details, locate the target topic NginxMetric; click the target topic to navigate to the metric topic query page, then click Browse Metrics and select a metric from the list to view.
8. Use metric search to analyze metric data and add the analysis results to the dashboard.
Bantuan dan Dukungan
Apakah halaman ini membantu?
Anda juga dapat Menghubungi Penjualan atau Mengirimkan Tiket untuk meminta bantuan.
masukan